Syllabus
Hao Ye Health Science Center Libraries, University of Florida (updated: 2023-04-19)
Intro
- Motivations Why should you care about this topic? Organizing your projects and data will:
- improve reproducibility
- enable you to scale up projects
- make it easier to build off it later this includes yourself at a later point!
- Learning Outcomes By the end of the workshop, participants will be able to:
- implement recommended practices for file and folder organization in projects
- use and apply file naming conventions
- understand the principles of tidy data for structuring tabular data
File and Folder Organization
- Principles
- You don’t want to spend time looking for stuff. Neither do your collaborators.
- Keep all files associated with a project in one place.
- project description
- data
- code
- figures
- manuscript
- Recommendations
- Use sub-folders to organize data, figures, manuscript, etc.
- separate raw and processed data
- Write
READMEfiles to document:- who did the experiments
- data formatting (more on this later)
- when/how/why
- Use sub-folders to organize data, figures, manuscript, etc.
- Structuring a Project Folder
project/
├── data/
├── figures/
├── output/
├── paper/
├── R/
└── README.md
- A Project README A plain text file containing:
- a short summary of project & goals
- guidance for interacting with the project
- (software) how to install and run it
- (paper) which file is the final report/paper
- (data) the summary figure or main file
- funding acknowledgments / how to cite
- Summary
- keep project stuff together in the same place
- files related to the project
- key information about the project (creating files for this if necessary!)
- give simple instructions to engage with your project
- think of it as a free sample that helps people decide if your project is useful to them!
- keep project stuff together in the same place
Naming Things
- Principles Choose names for files that:
- are machine-readable
- are human-readable
- sort nicely
- Examples (NOT SO GOOD)
Hao's data with spaces & punctuation.xlsx
01.R
figure 1.png
fig 2.jpg
report-final FINAL HY-comments ver3.docx
- Examples (BETTER)
hao_learned_about_underscores.xlsx
01_import-data.R
fig01_scatterplot_length-vs-interest.png
fig02_histogram_talk-attendance.png
yearly-report_2020-06-01_hy-comments.docx
- Machine-Readable
- Avoid spaces, punctuation, accented characters, mixing CAPS and lowercase.
- computers can struggle with these
- simple names are easier to remember
- Separate words with hyphens
'-' - Separate groupings with underscores
'_'
- Avoid spaces, punctuation, accented characters, mixing CAPS and lowercase.
- Human-Readable
- Filenames do not need to be very detailed
- Filenames should help you find it later when you need to
- For code, use nouns for data objects and verbs for actions:
load-data.Rdata_mtcars.csvmake-scatterplot.R
- Using Default Ordering
- Files can be sorted alphabetically (and usually)
- we can make use of this!
- Left-pad with numbers to impose an order on files:
- e.g.
01_load-data.R,02_process-data.R
- e.g.
- Use RFC-3339 for dates:
-
YYYY-MM-DDformat (alphabetical sorting makes it chronological, too!)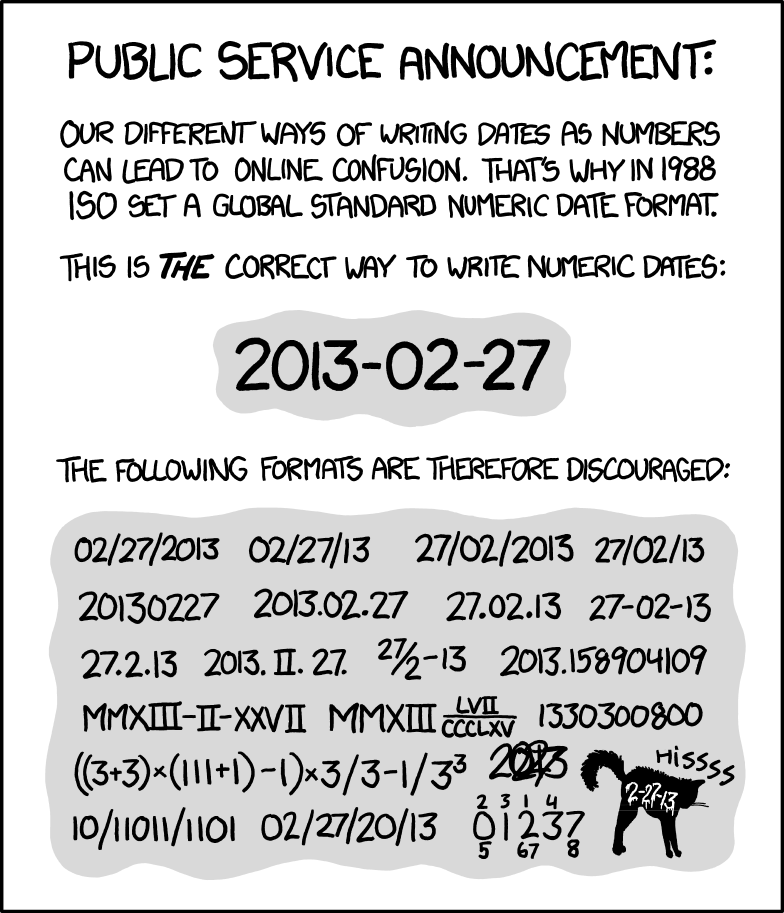 xkcd/1179
-
- Files can be sorted alphabetically (and usually)
- Example
siteA_2020-04-01_animal-count.xls
siteA_2020-05-01_animal-count.xls
siteB_2020-04-01_animal-count.xls
siteB_2020-04-01_weather.dat
siteB_2020-05-01_animal-count.xls
siteB_2020-05-01_weather.dat
files are organized by site -> date -> type of measurement - Summary
- you probably use names to organize files already!
- use these tips to improve your system
- consistency is important!
- you probably use names to organize files already!
Structuring Tabular Data (e.g. spreadsheets)
- Principles Make it easy for anyone to work with your data:
- Structure data for analysis (i.e. “Tidy Data”)
- Store important information explicitly
- Keep an archive of raw data
- Include a Data Dictionary
- Tidy Data Properties of tidy data:
- each column is a variable
- each row is an observation
- each table is a single observational unit
- Common issues
- data values are stored in column headers
- e.g. treatment values, dates of sampling
- multiple variables are stored in one column
- variables are stored in rows and columns
- “1 observational unit = 1 table” is violated
- e.g. subject info and measurements are stored in the same table
- data values are stored in column headers
- Example: column labels encoding data
- wide-format data |name|Thin Mints|Samoas|Tagalongs| |–|–|–|–| |A|4|0|0| |B|2|0|2| |c|0|3|1|
- Example: re-structured columns
- long-format data |name|flavor|boxes| |–|–|–| |A|Thin Mints|4| |B|Thin Mints|2| |B|Tagalongs|2| |C|Samoas|3| |C|Tagalongs|1|
- Example: multiple observational units |name|address|flavor|boxes| |–|–|–|–| |A|3828 Piermont Dr|Thin Mints|4| |B|221B Baker St|Thin Mints|2| |B|221B Baker St|Tagalongs|2| |C|124 Conch St|Samoas|3| |C|124 Conch St|Tagalongs|1|
- Example: separate tables .pull-left[ |name|flavor|boxes| |–|–|–| |A|Thin Mints|4| |B|Thin Mints|2| |B|Tagalongs|2| |C|Samoas|3| |C|Tagalongs|1|] .pull-right[ |name|address| |–|–| |A|3828 Piermont Dr| |B|221B Baker St| |C|124 Conch St|]
- Spreadsheet Formatting
- for missing data, use empty cells or
'NA'- be careful about
'NA'for certain types of data (e.g. country code for “Namibia”)
- be careful about
- do NOT space out data with empty rows/columns
- do NOT use text formatting (e.g. bold/italics) to store information
- WATCH OUT: Excel LOVES to convert data into a date format
- for missing data, use empty cells or
- Example: spreadsheet formatting
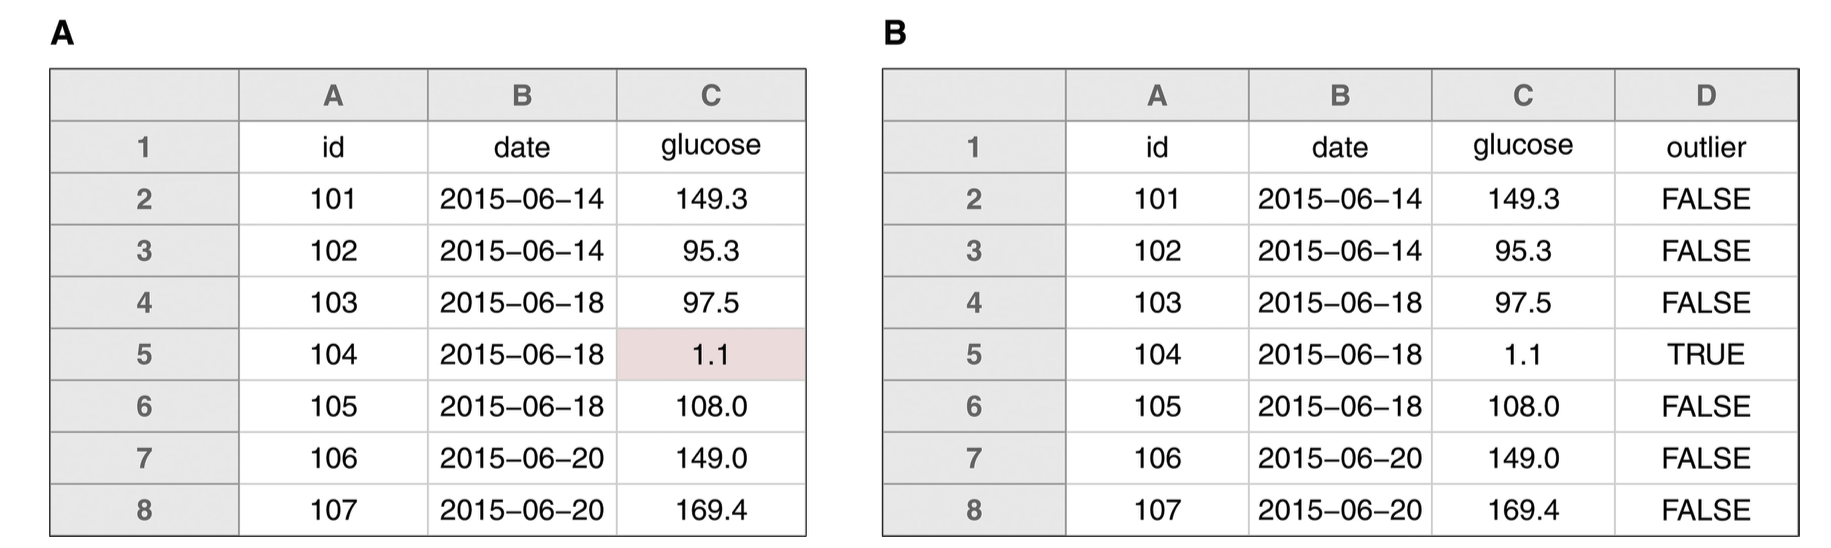 Instead of highlighting the cells with outliers, encode outlier status as its own column.
 - Raw Data
- store raw data for reproducibility
- copy and modify files instead
- and/or use scripts to clean/wrangle raw data
- document processing steps in code or text
- someone else can see what processing was done, and reproduce it
- OpenRefine is a great tool for cleaning messy data (and records the steps for you)!
https://uf-repro.github.io/OpenRefine-intro/
- store raw data for reproducibility
- Data Dictionary
- define your rows and columns
- e.g. do rows correspond to:
- individual subjects
- OR data collection sessions
- OR individual samples from a measurement device
- e.g. do rows correspond to:
- define codes, categories, acronyms
- define relationships between multiple tables
- provide metadata details
- define your rows and columns
- Example Data Dictionary .compact-table[ |name|plot_name|group|description|type| |–|–|–|–|–| |mouse|Mouse|demographic|Animal identifier|text| |sex|Sex|demographic|Male (M) or Female (F)|factor| |sac_date|Date of sac|demographic|Date mouse was sacrificed|date| |partial_inflation|Partial inflation|clinical|Indicates if mouse showed partial pancreatic inflation|logical| |coat_color|Coat color|demographic|Coat color, by visual inspection|factor| |crumblers|Crumblers|clinical|Indicates if mouse stored food in their bedding|logical| |diet_days|Days on diet|clinical|Number of days on high-fat diet|numeric|] (modified from Figure 9 of Broman & Woo “Data Organization in Spreadsheets”)